The data infrastructure for Latin America's forests
Forest projects earn trust when the evidence beneath them is real. Understory measures forests tree by tree (biomass, structure, biodiversity and growth) and turns that ground truth into documents auditors, registries and funders rely on.
Hardware, software, ML and operations. One team.
Building the field layer of forest data takes four disciplines that rarely live in one company. We ship all of them, together.
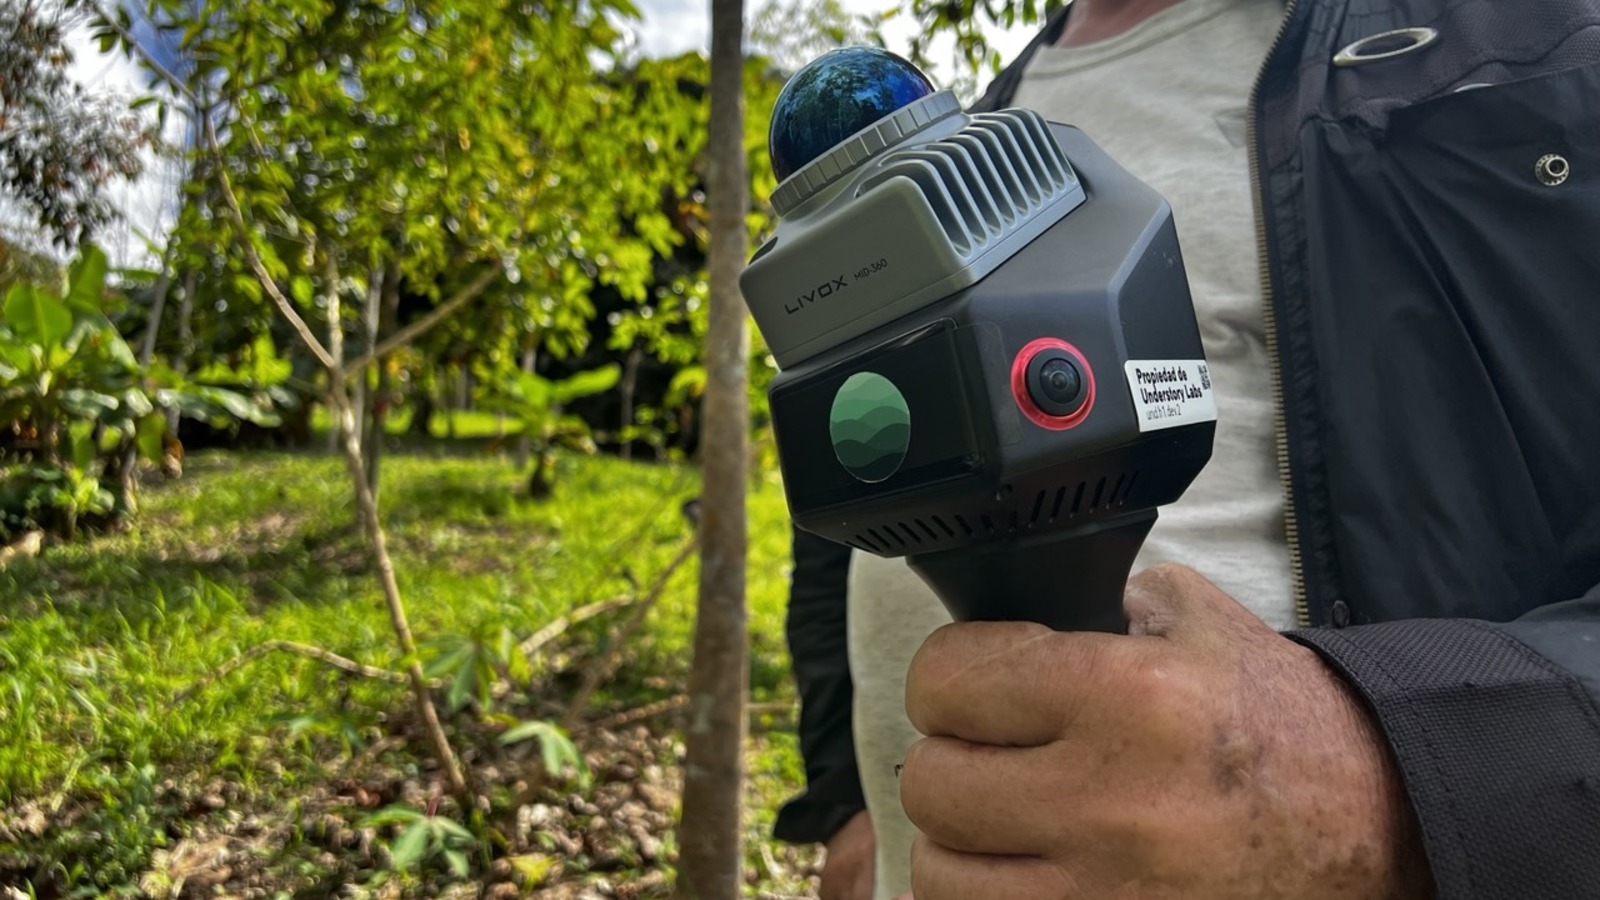
A multi-sensor rig built for the forest
LiDAR, 360° cameras and GNSS in one field unit, engineered by hardware alumni of NASA and Intel. Leased to your project, not sold.
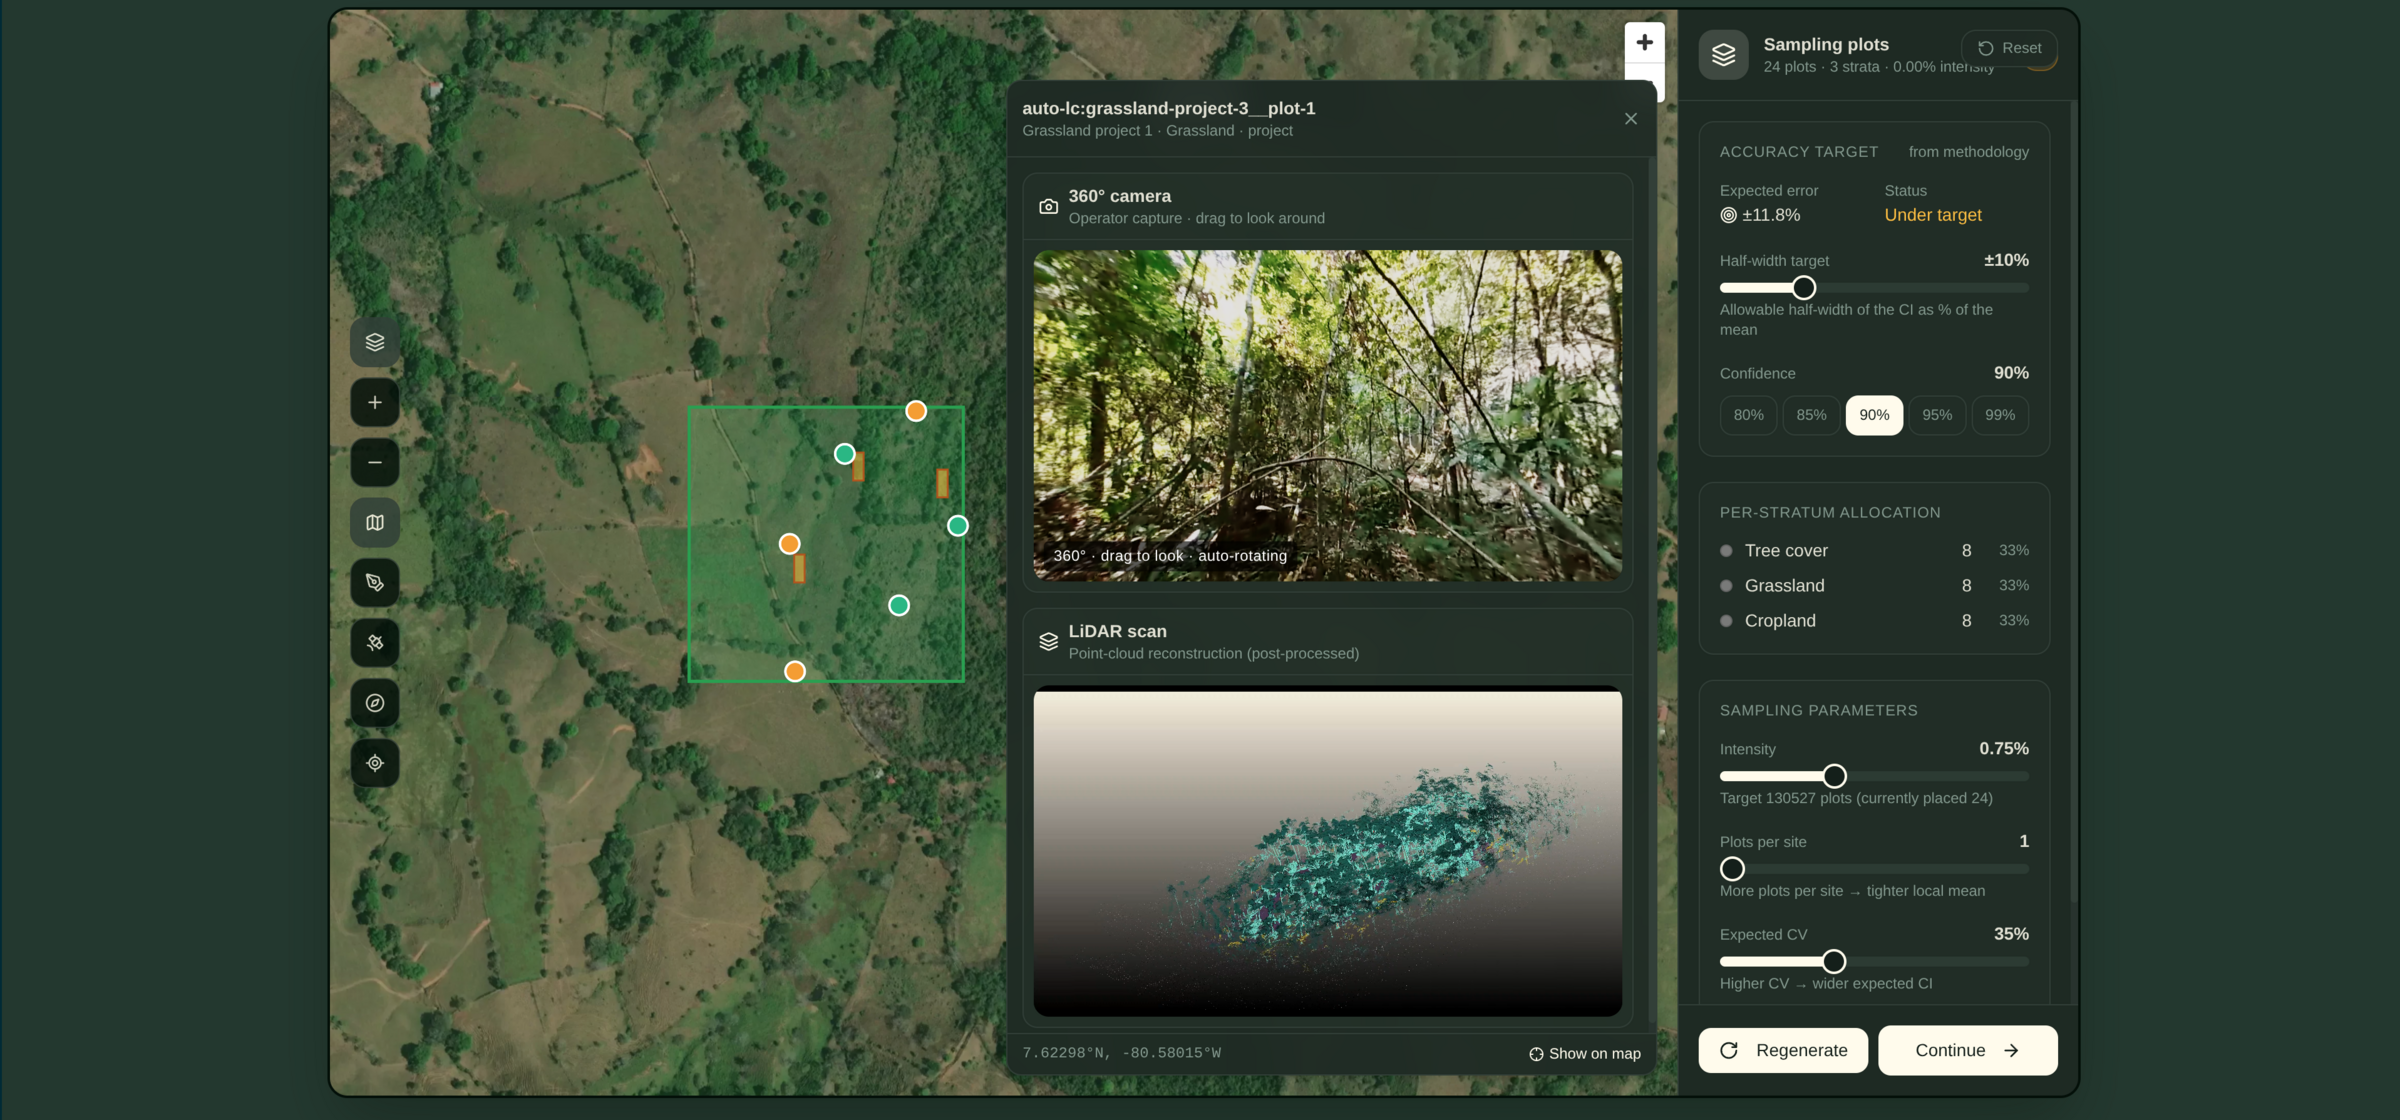
UnderstoryOS, from plan to document
Monitoring plans generated from the methodology, daily field QA, and validation documents produced from the same measured record.
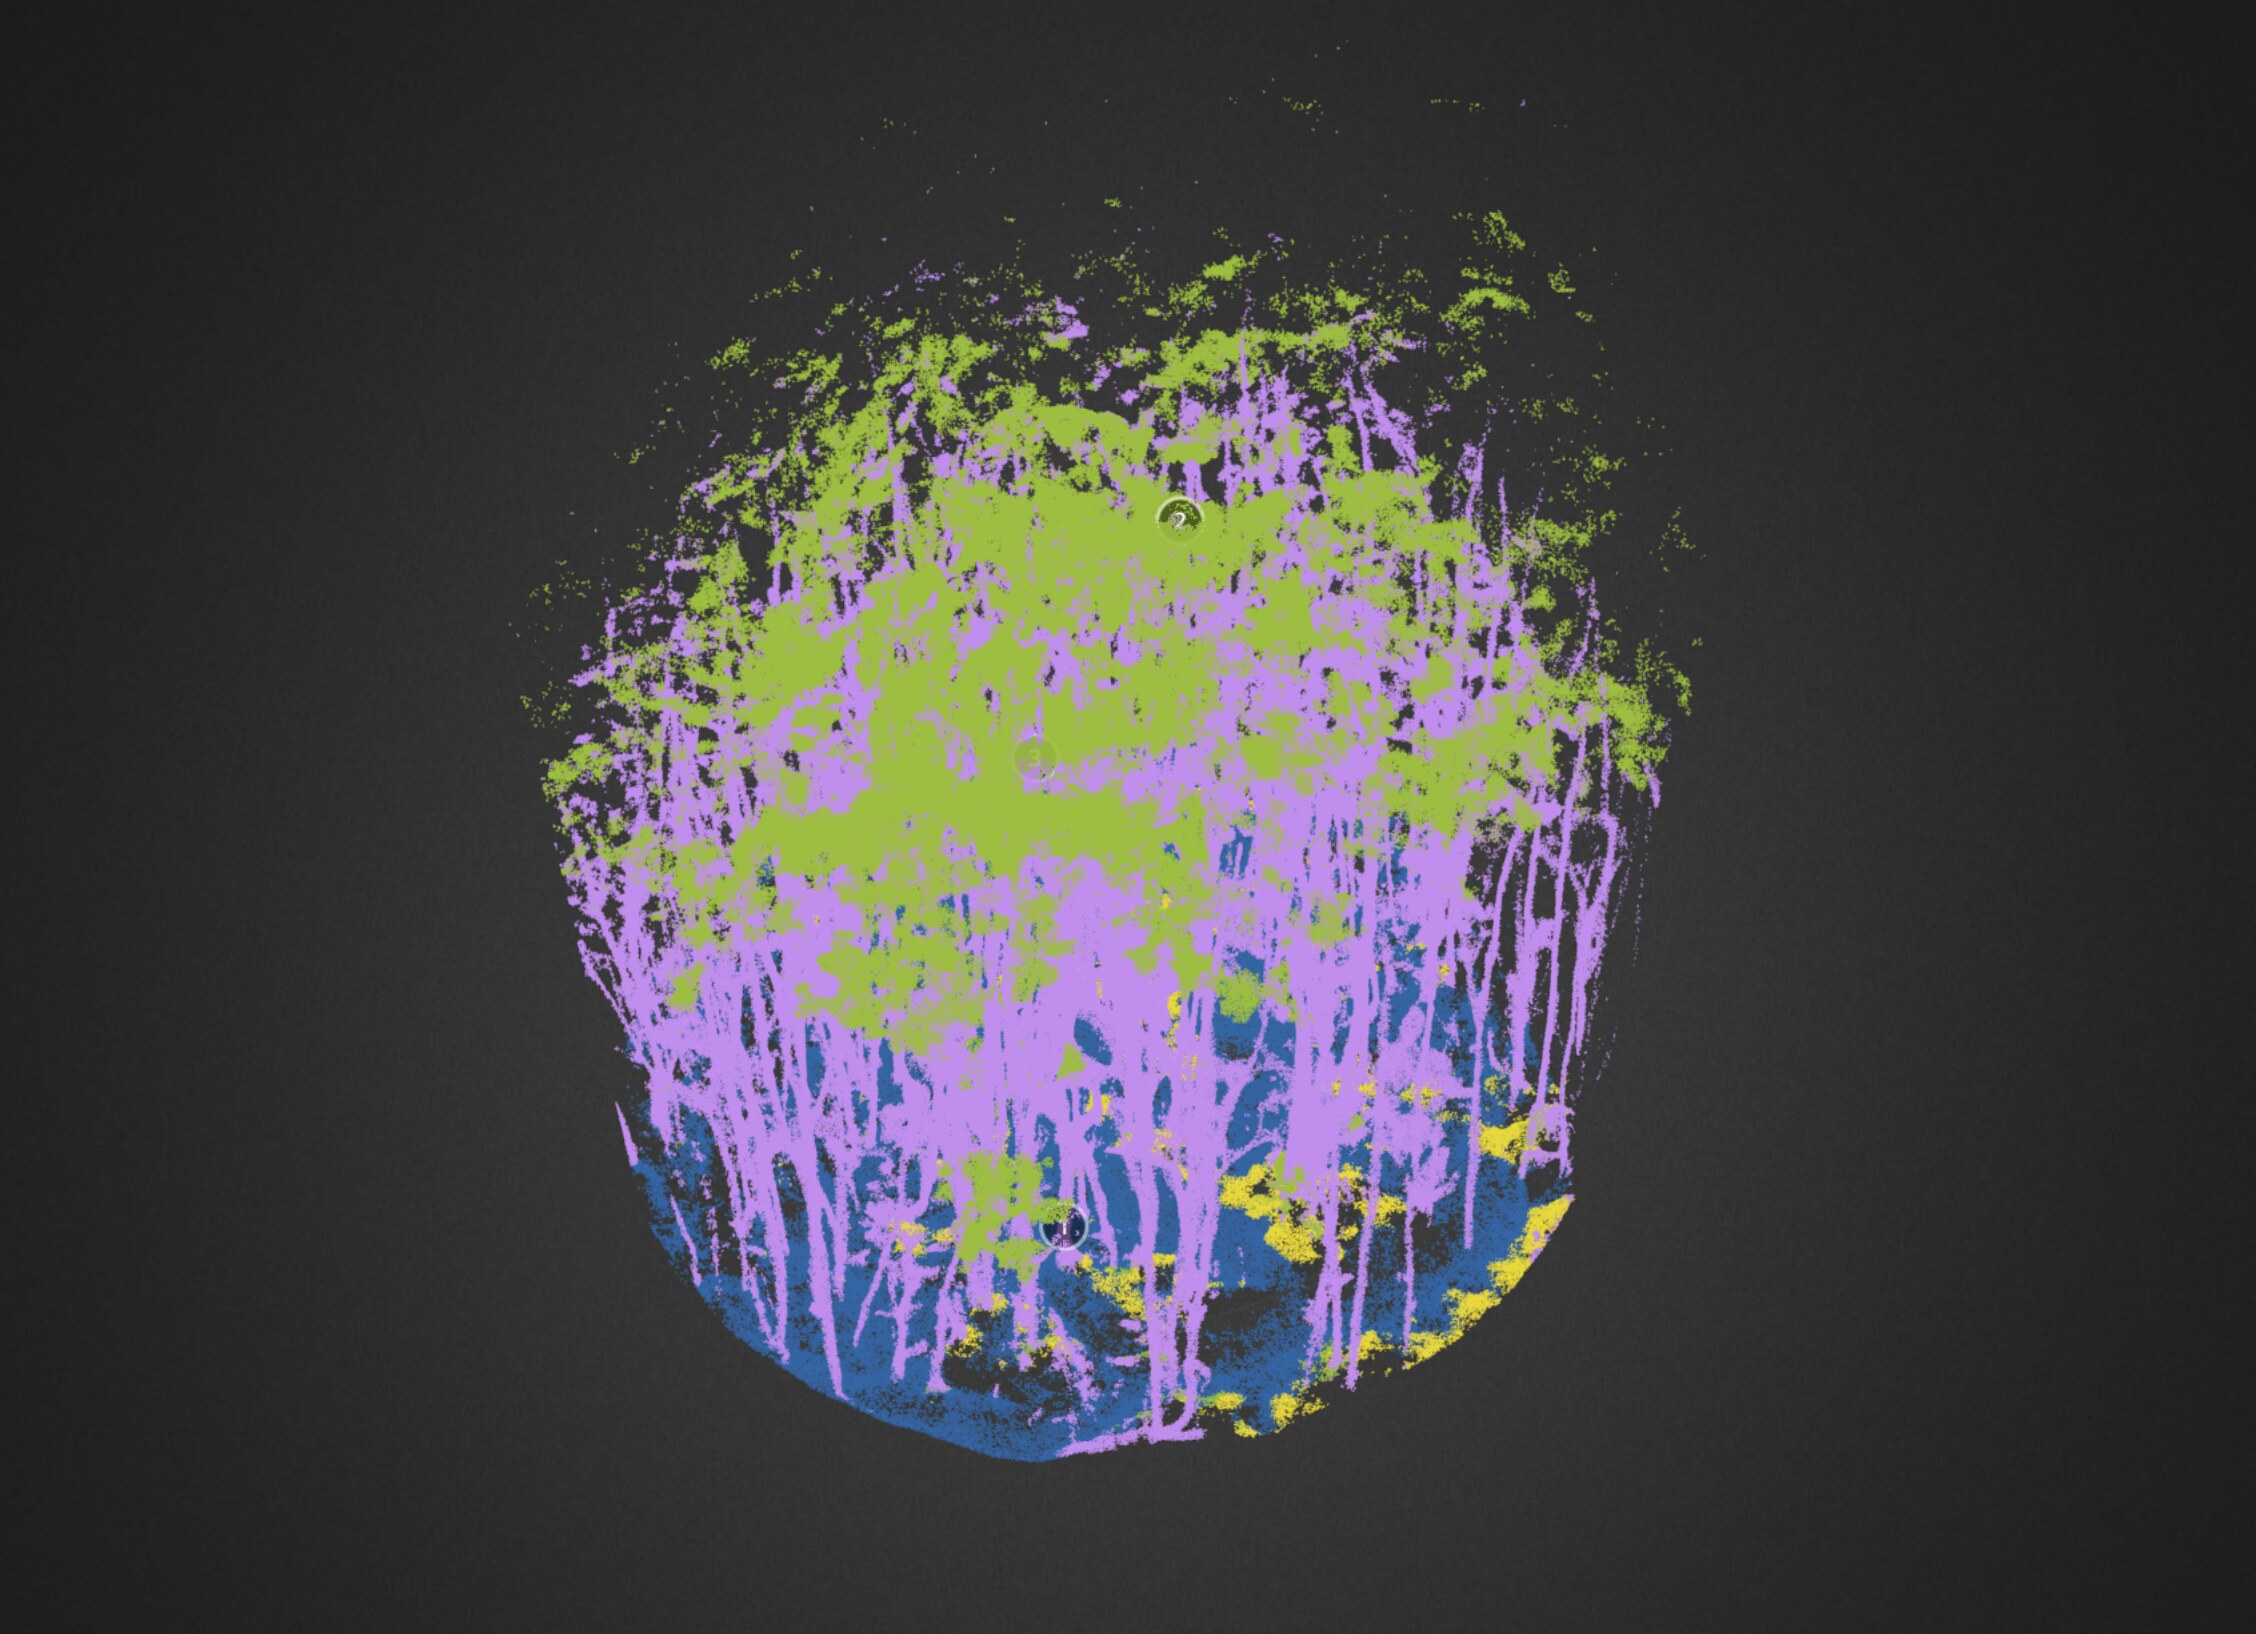
Tree-level intelligence
Tree segmentation, species identification and biomass models, trained on a growing tree-level ground-truth corpus across the tropics.
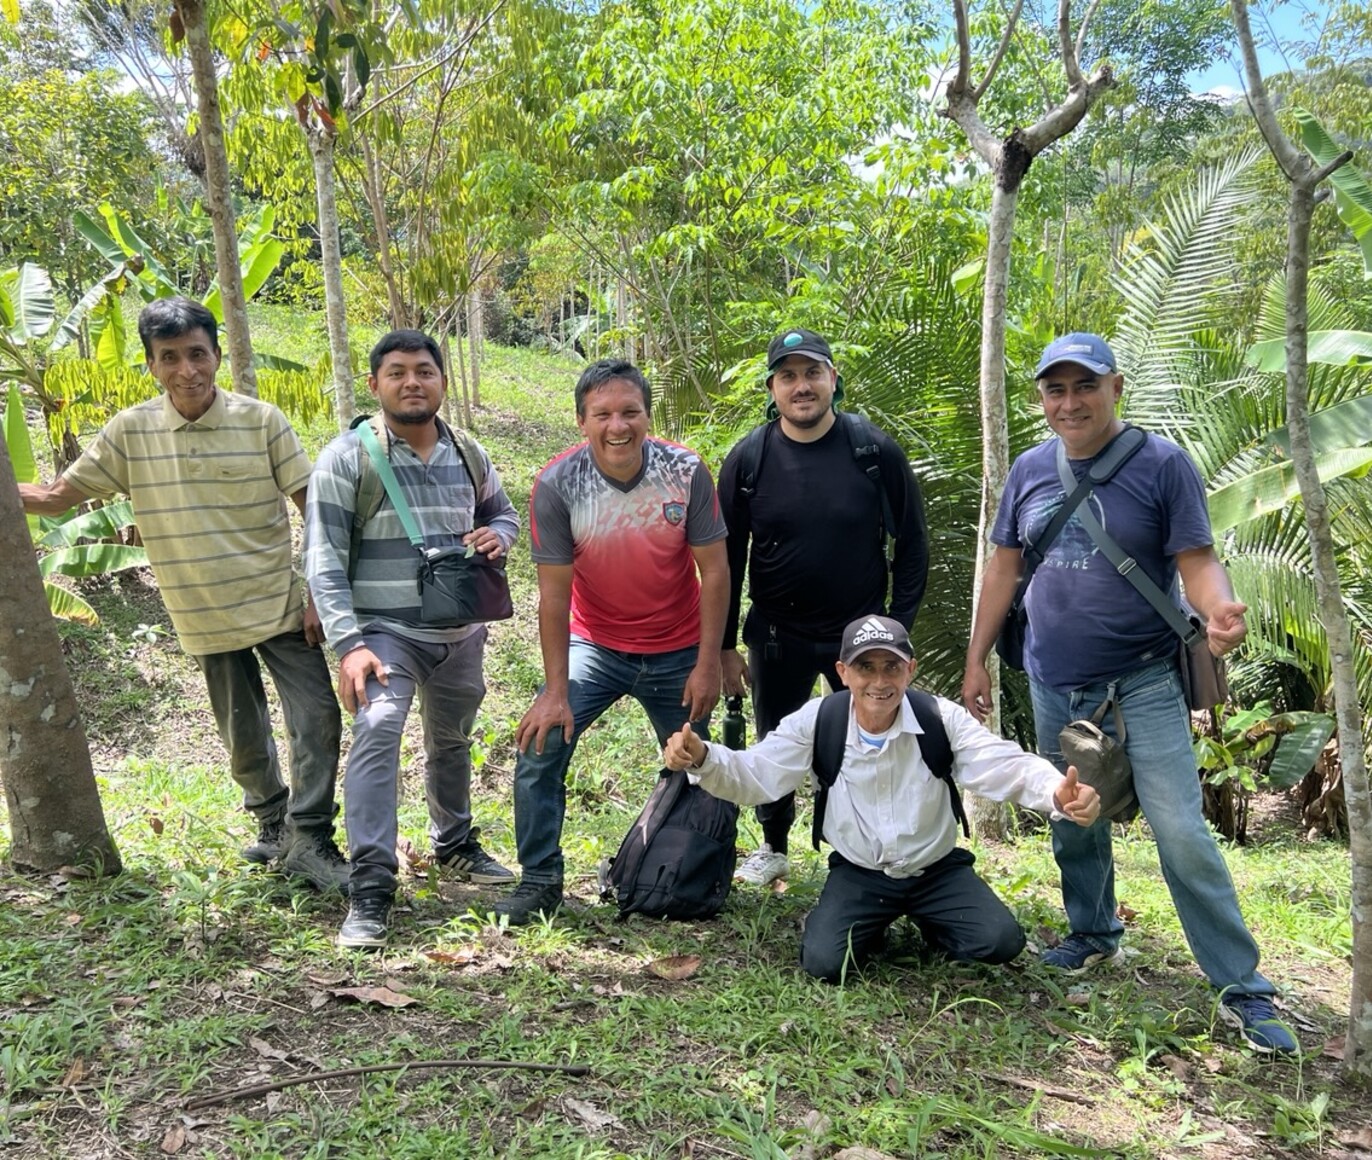
Local teams, trained and paid
Field campaigns run by local operators we train and equip: 20 minutes per one-hectare plot, audit-ready on first submission.
Satellite, drone and ground. One calibrated pyramid.
Each altitude sees something the others cannot. Satellite scales, drone maps, and the ground layer anchors them both with measured truth, so every number above is calibrated by a tree below.
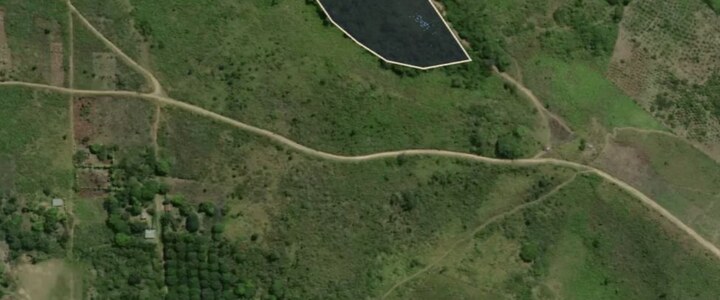
Screen and stratify
Wall-to-wall context for pipeline qualification and continuous change monitoring over millions of hectares.
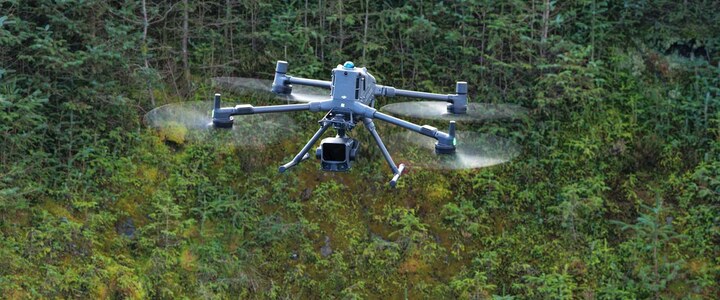
Map the landscape
Canopy height and structure over whole project areas, flown in days, tied to the ground plots below.
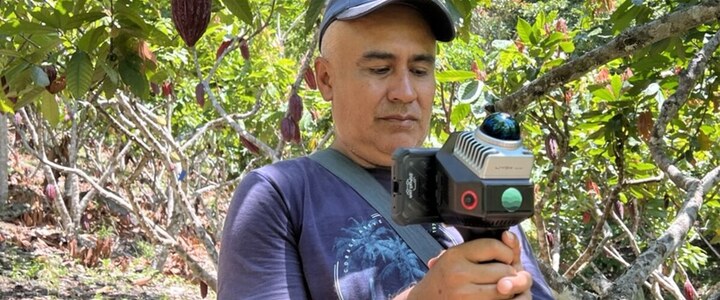
Measure the truth
Mobile LiDAR under the canopy: stems, species and biomass, tree by tree. The layer that calibrates everything above.
One scan. Every layer of forest data.
A single LiDAR + 360° walk resolves the whole forest — from canopy structure down to individual-tree growth — all from one measured, re-analyzable dataset.
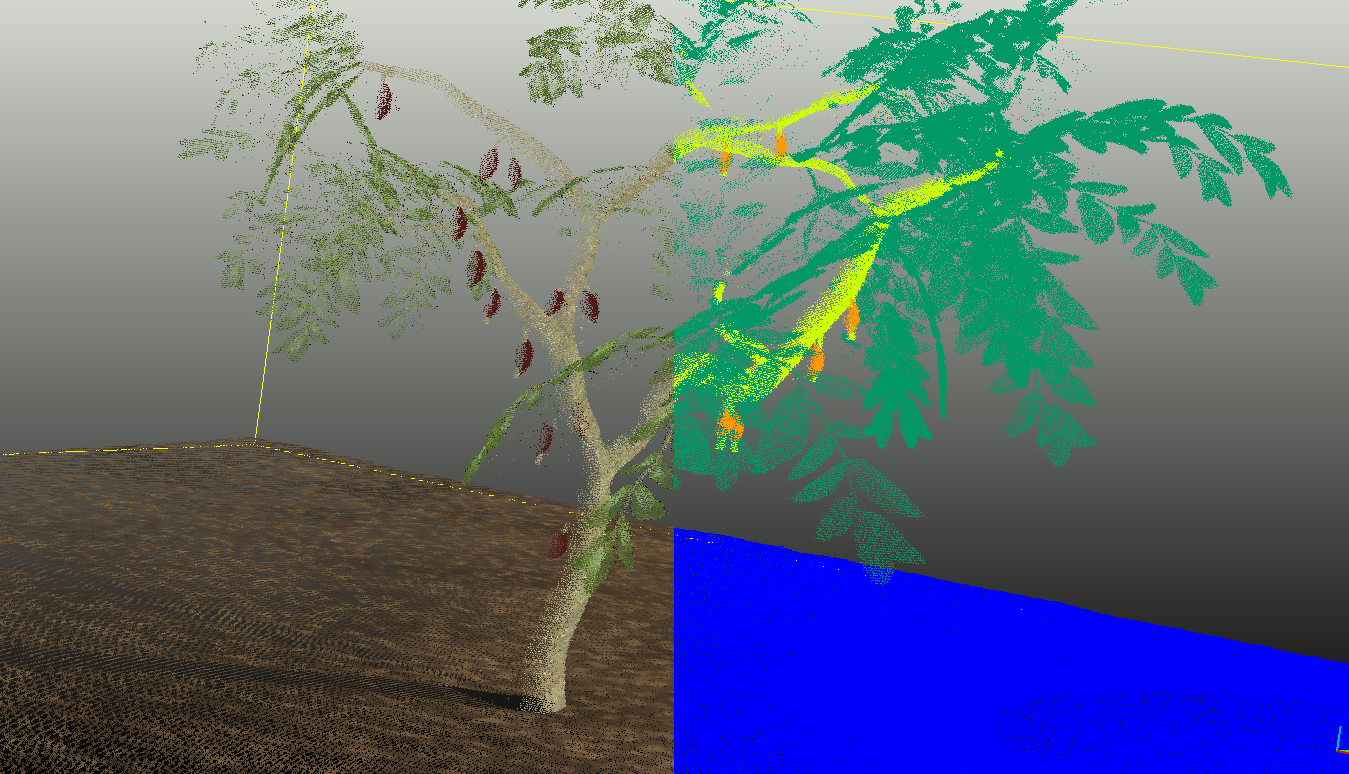
Forest Structure
3D canopy, height, density and vertical profile
Species
Per-tree species identification and composition
AGB & Carbon
Biomass and carbon from measured allometry
Understory & Restoration
Regeneration, ground cover and restoration state
Tree-Level Growth
Year-over-year change tracked tree by tree
From the methodology's requirement to the auditable document
- Monitoring plans built from the methodology: stratified sampling and accuracy targets, filed before fieldwork starts
- In the field: your crew, our hardware: nightly uploads, daily QA, mid-campaign plot adjustment
- Documentation: PDDs, monitoring reports and safeguard reports with a click-through trail to raw sensor data
- A permanent, re-analyzable archive that carries a project from its first plot to full scale
One measured data layer, five ways to use it
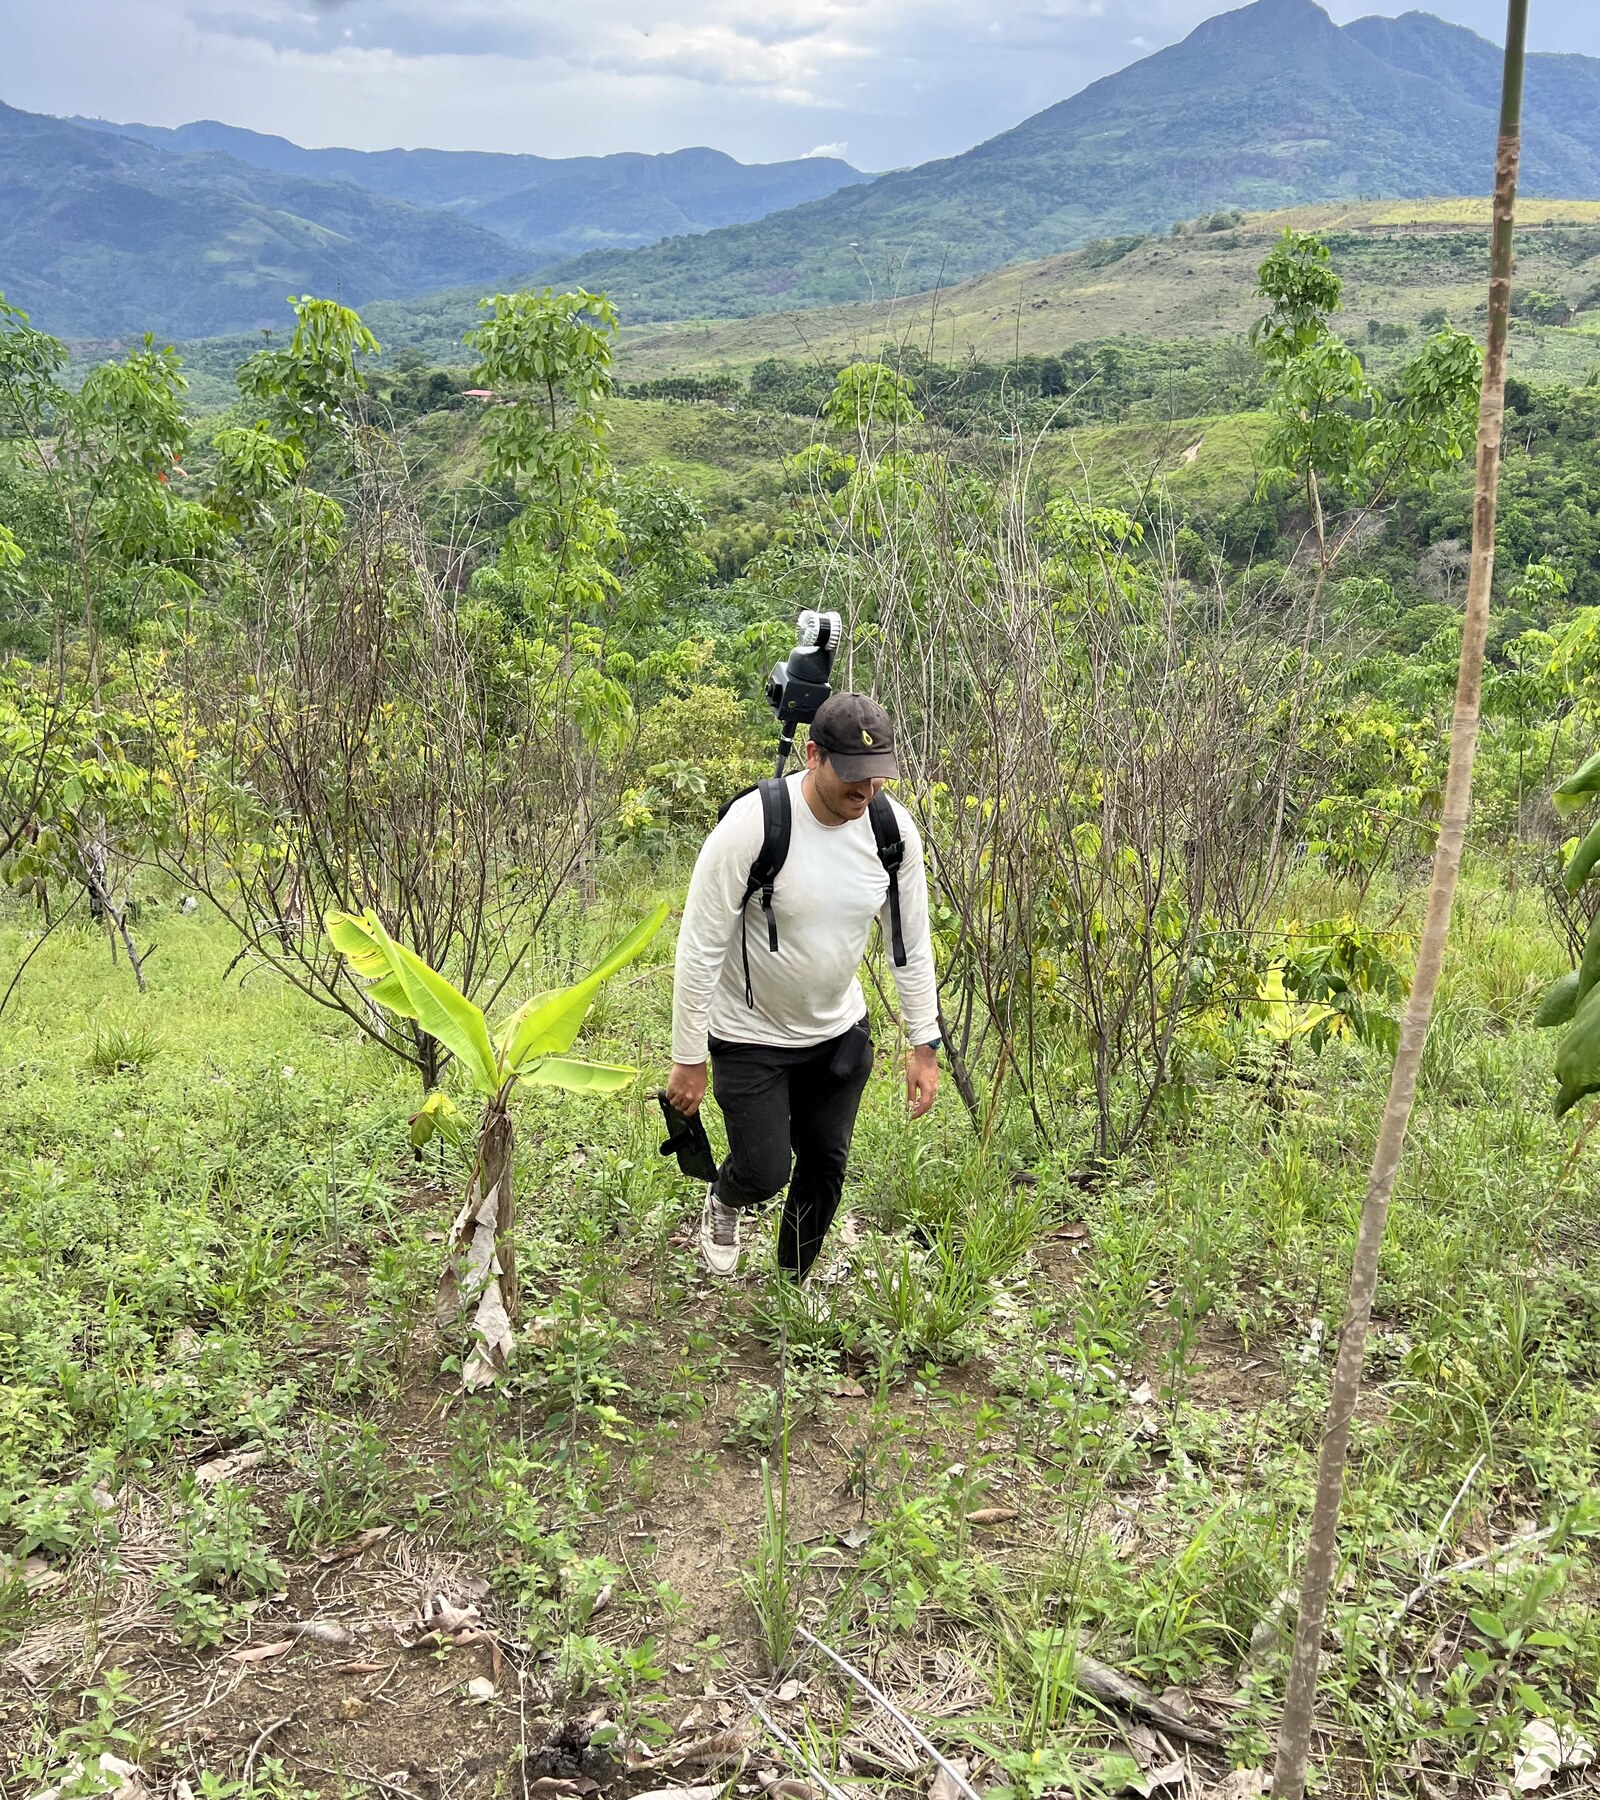
Survival, gaps and growth against the baseline: restoration progress as a measurement, not a claim.
Learn more →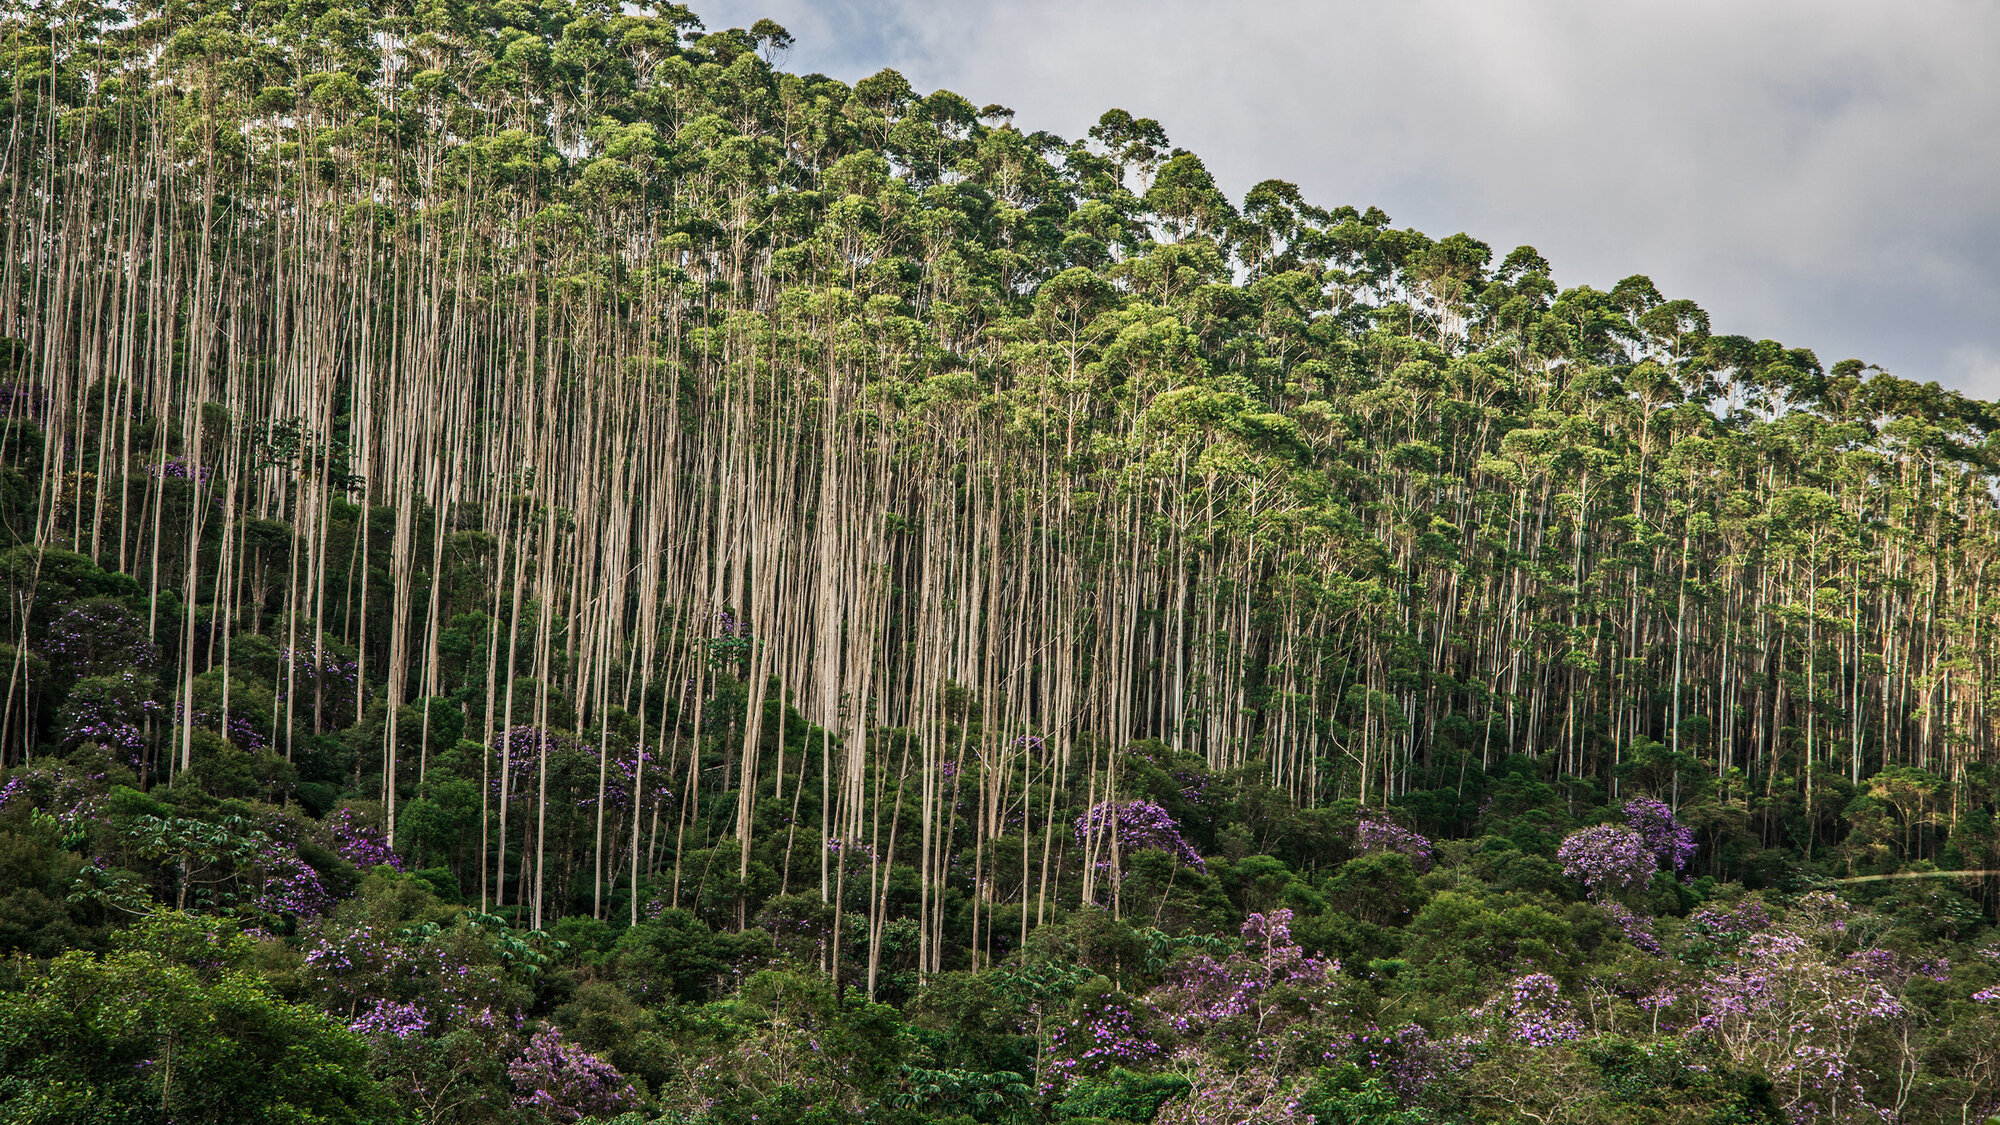
Census, volume, sortment and annual increment for plantations and sustainable timber.
Learn more →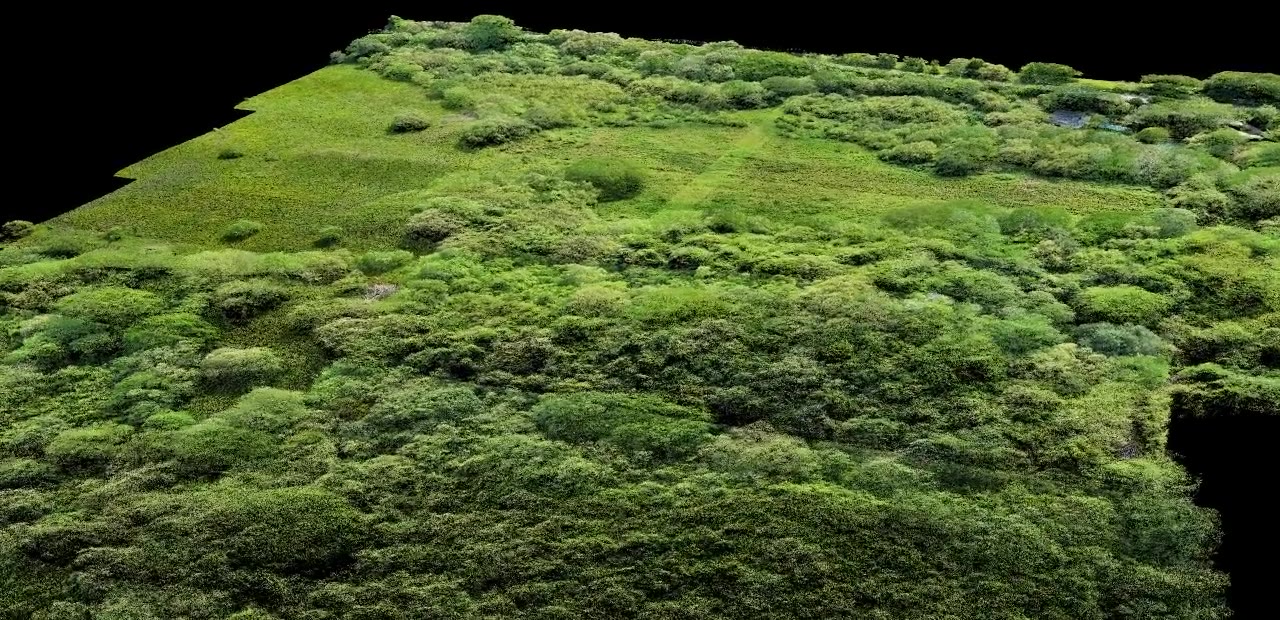
Baselines and monitoring on measured biomass, with the traceability a certifier demands.
Learn more →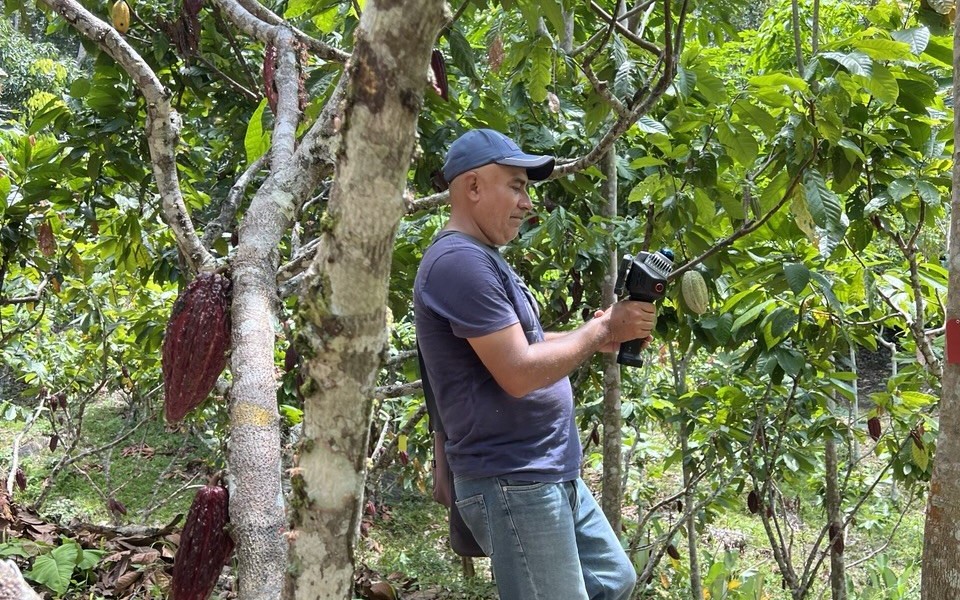
Species census and per-tree harvest estimation for aguaje, brazil nut and cacao.
Learn more →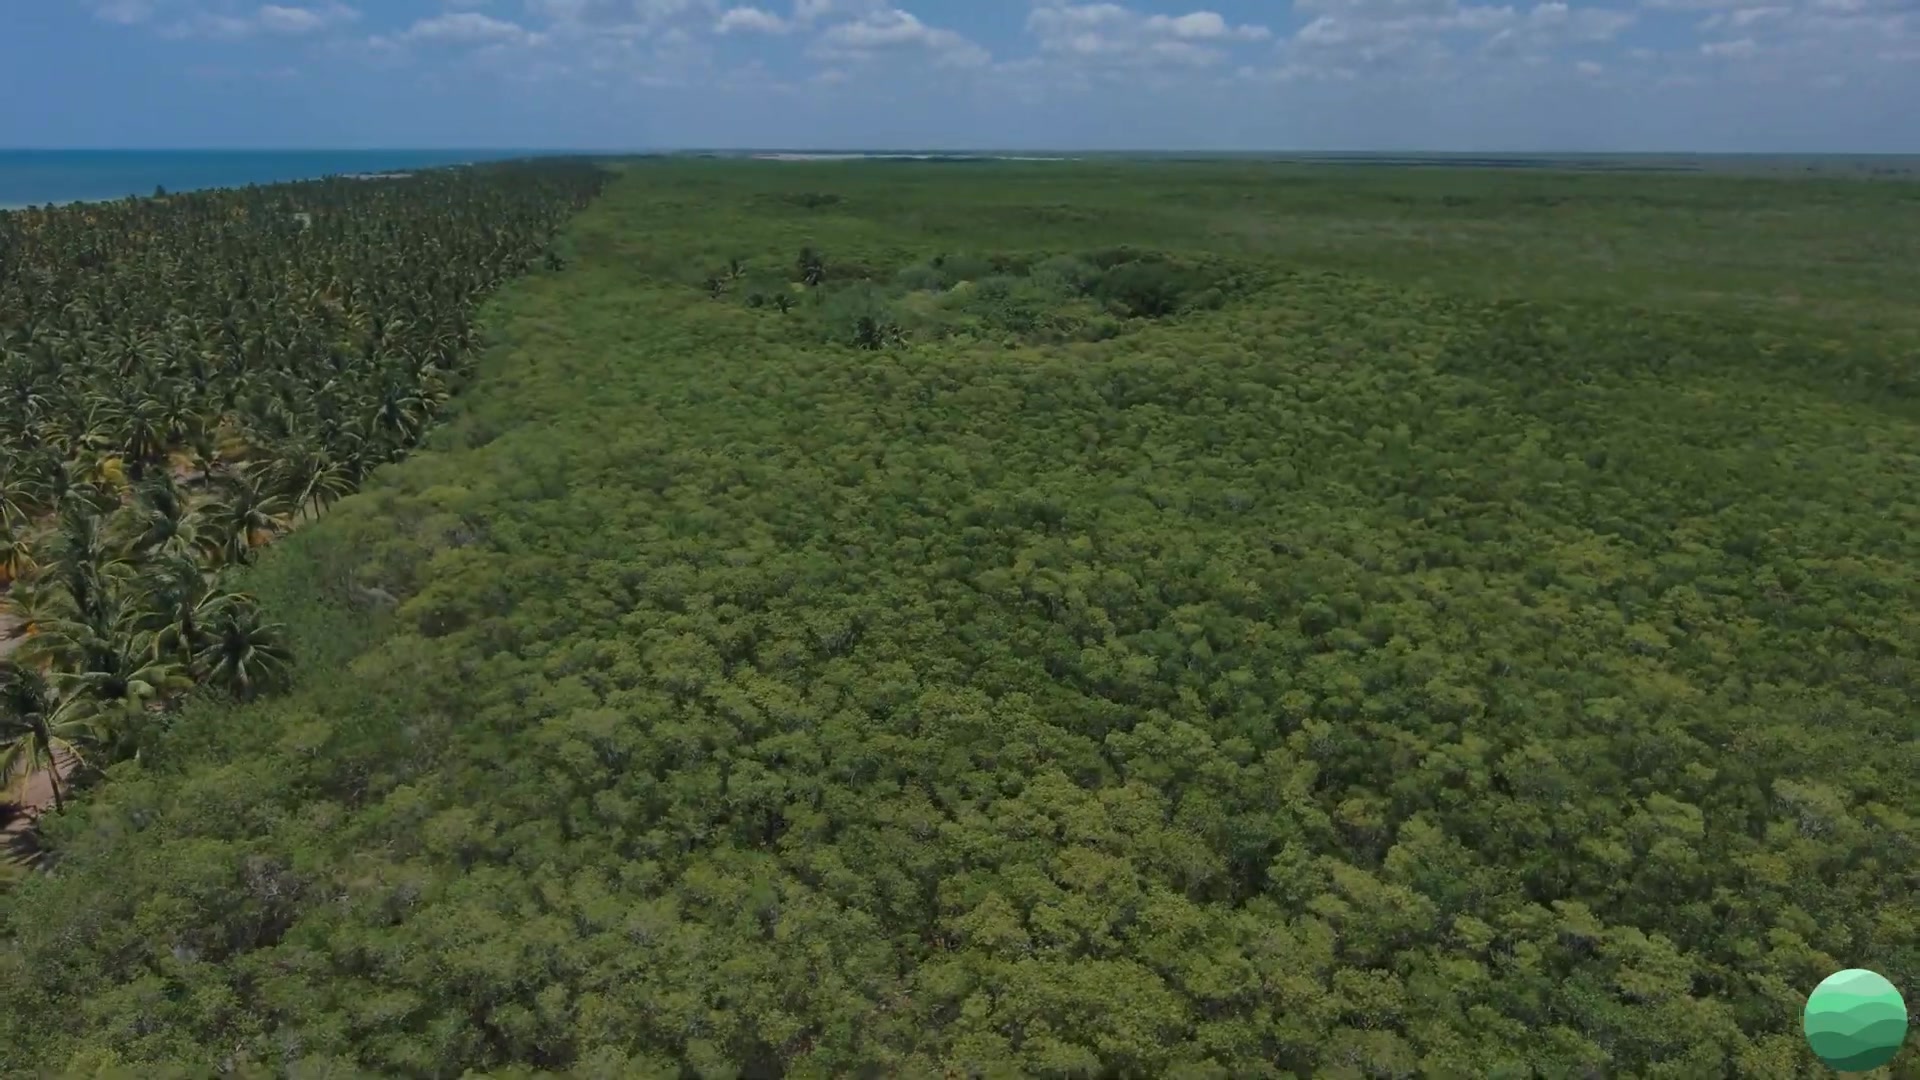
Per-tree structure and blue carbon in restoration banks, scanned by the community itself.
Learn more →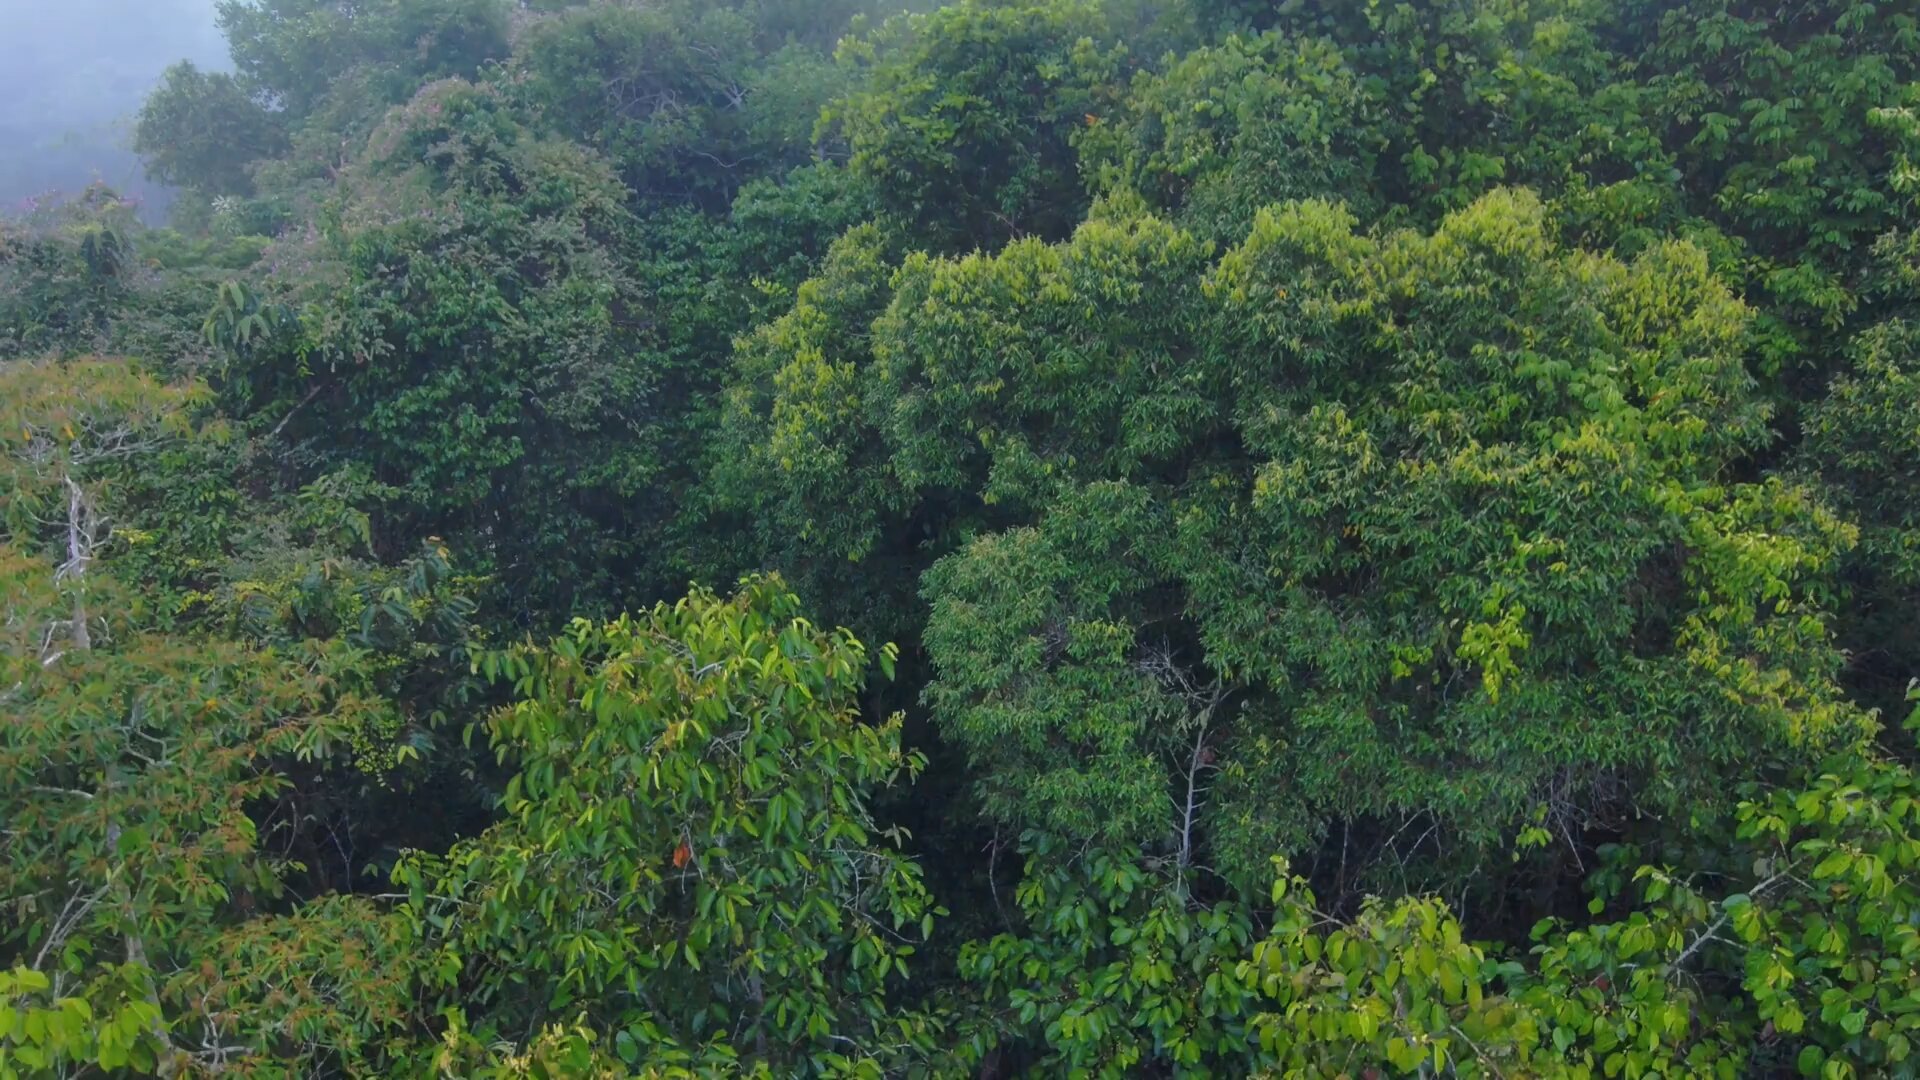
Structural and species diversity indicators from the same measured scans.
Coming soonAlready deployed with developers and communities across LATAM





Ready to lower your MRV cost?
Send us your project boundary and target methodology. We'll come back with a monitoring plan preview and a fixed-price pilot scope.
Get project updates
Field campaigns, methodology pilots and platform releases. No noise.